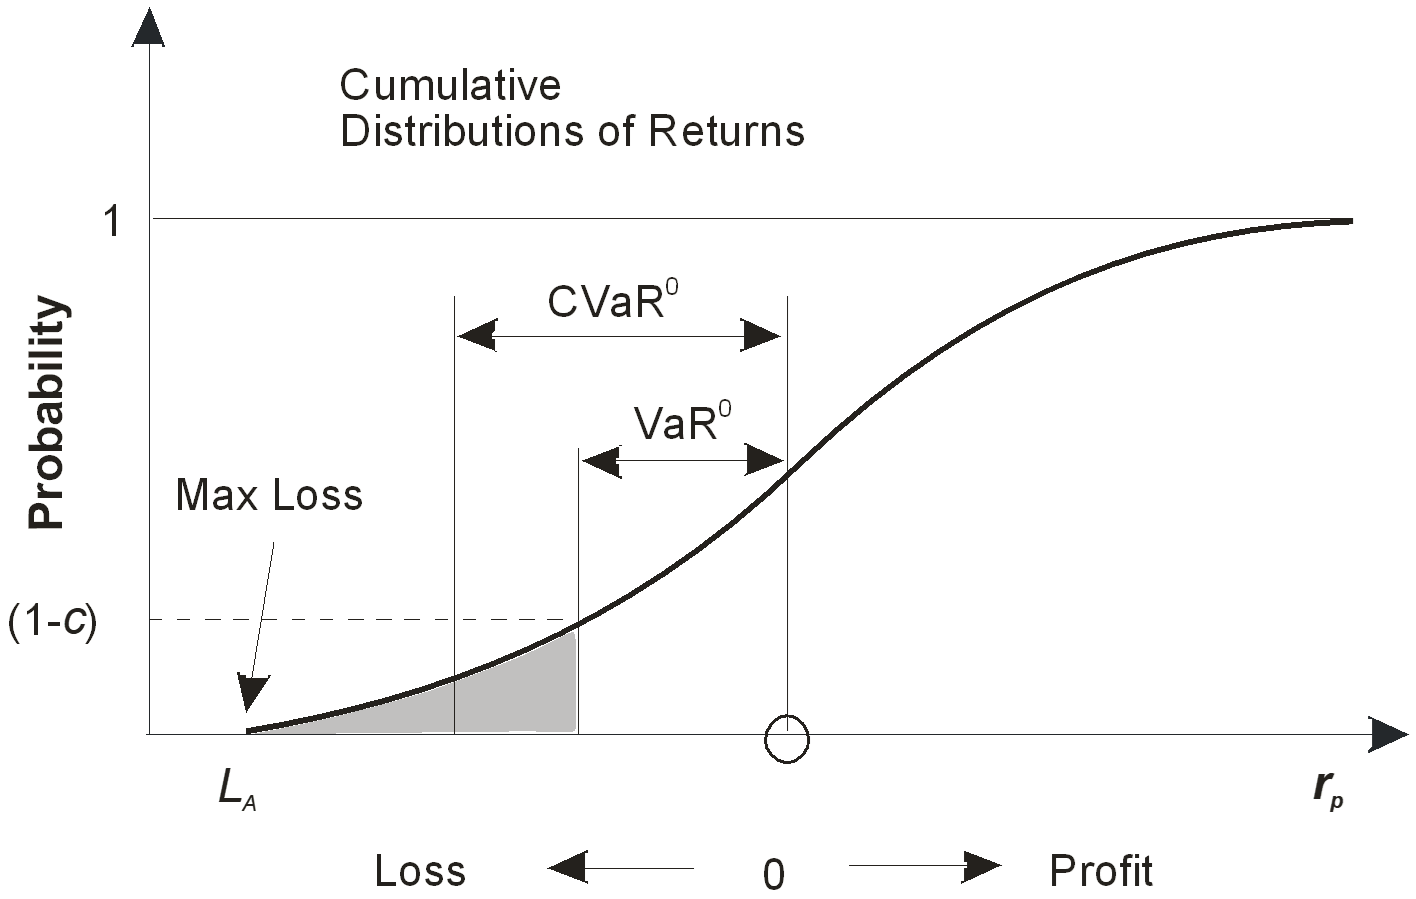
The Conditional Value-at-Risk (CVaR) is also called Expected Tail Loss (ETL), Tail VaR, Mean Excess Loss, or Shortfall Risk. The CVaR is defined as the expected value of the losses assuming that the losses exceed the VaR. The following figure shows relation between the VaR and the CVaR. The grayed area presents tail losses exceeding the VaR. Consequently, the mean expected loss within that area is equal to the CVaR. Since CVaR ≥ VaR, it tends to overestimate risks. For short-tailed distributions CVaR estimate is uninformative in comparison with the corresponding VaR, because the difference between them is insignificant.
The breakdown of the key components of Conditional Value-at-Risk
- Time Horizon. CVaR is measured over a specific time interval, indicating the potential loss within that timeframe. Common time horizons include one day, one week, or one month
- Confidence Level. The confidence level represents the probability that the actual loss will not exceed the calculated VaR value. For example, a 95% confidence level implies that there is a 5% chance that the actual loss will be greater than the VaR.
CVaR Interpretation
CVaR estimates a potential loss below the VaR the specified confidence level over a given time horizon. For example CVaR of -7% (1-month time horizon and 5% confidence level) means that theref is a 5% chance that the average losses over 1-month period will be -7%.
CVaR Pros
- It does not rely on the assumption of normality in the distribution of returns.
- VaR can be used for scenario analysis and stress testing.
- CVaR is better than VaR for downside risk estimates.
- CVaR is a convex function, simplifying the process of portfolio optimization.
- CVaR exhibits the subadditivity property. This means that the CVaR of a portfolio is less than or equal to the sum of individual asset CVaRs.
CVaR Cons
- Like all risk statistics derived from distribution models, Value-at-Risk (VaR) doesn't consider the sequence of asset returns. Consequently, assets with identical VaR values may experience different drawdowns within the designated time horizon.
- Relying solely on CVaR can yield misleading results and potentially underestimate risks. For instance, an asset may exhibit a seemingly low risk according to its CVaR. However, if this low-risk scenario repeats consistently across numerous consecutive periods, the cumulative negative returns may ultimately prove to be unacceptable.
- Difficulties of calculating CVaR ratios, similar to the Sortino or Sharp ratios, because VaR values can be poisitive or negative. Risk Shell proprietary statistics include a special CVaR ratio incorporating a linear transformation of CVaRs of underlying assets to ensure that all the CVaRs are either positive or negative.
-
JOIN OUR WEBINAR
Pros and cons of VaR: tips and techniques for using VAR-derived statistics in multi-asset portfolios.
Pros and cons of VaR
17 Feb 2026;
04:00PM - 05:00PM
Unique Hedge Fund problems25 Feb 2026;
09:00AM - 10:00PM
Pros and cons of VaR03 Mar 2026;
04:00PM - 05:00PM
Unique Hedge Fund problems17 Mar 2026;
04:00PM - 05:00PM
Unique Hedge Fund problems18 Mar 2026;
09:00AM - 10:00PM
Pros and cons of VaR31 Mar 2026;
04:00PM - 05:00PM
Unique Hedge Fund problems
The ABC Quant video materials and tutorials available on or through this website are protected by copyright and international intellectual property laws. Your right to view the ABC Quant video materials and tutorials is strictly on invitation only basis. You may not download, distribute or otherwise publish, copy, transmit, modify, reverse engineer, or sublicense any video content and/or tutorials available on or through this website.