Alternative Investment Management Software

Risk Shell

Institutional portfolio management, risk analytics and portfolio construction for alternative and multi-asset portfolios.

Integrated investment data, stress testing, portfolio optimization, alternative investment analytics and shadow accounting within one platform.

FoF Manager hero
FoF Manager

Shadow Accounting for Alternative Portfolios

Manage hedge funds, private equity and multi-asset portfolios with liquidity controls, custom classifications and flexible historical accounting.

35+ hedge fund liquidity settings
Explore FoF Manager
Optimization hero
Portfolio Optimization

Nonlinear Portfolio Optimization

Construct hedge fund-of-funds and multi-asset portfolios with stress-test, factor-exposure, liquidity and other user-defined constraints.

Custom Constraints for market-neutral and risk-controlled portfolio construction
Explore Portfolio Optimization
Risk Shell AI hero
Risk Shell AI

Natural-Language Access to Risk Shell

Use natural language to access investment research, risk analytics and portfolio workflows.

2.3B tokens in our in-house financial LLM
Explore Risk Shell AI
Macroeconomic Scenario Screening hero
Macroeconomic Scenario Screening

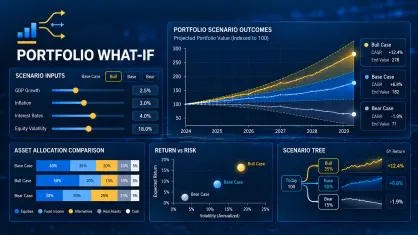
Select Assets for the Scenario You Define

Screen managers by risk and return targets under user-defined macroeconomic scenarios.

Trend Segmentation™ proprietary regime-analysis engine
Explore Scenario Screening
Peer-relative Stress Testing
Portfolio Stress Testing

Peer-Relative Stress Testing

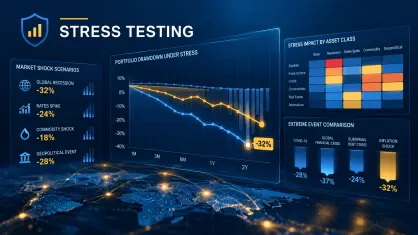
Compare extreme-event outcomes with a relevant peer group.

500K+ live stress-tested instruments
Explore stress testing
Rank assets in a group

Run FlexiRank™ to get ranking scores for each asset in a group.

  • Score every asset in the group on the FlexiRank™ statistic
  • Apply the same criterion to a portfolio, a peer set, or a group from more than one data set
  • Read the top and bottom of the order, then analyze the constituents

FlexiRank™ Workflow

FlexiRank™ workflow is a simple four-step process that can be applied to any groups of supported assets. Users can define thousands of ranking criteria based on their risk-return aversion and investment mandates.

  • Select assets to rank

    Choose the investment universe to rank.

    • Filtered search results
    • Saved asset sets (wallets)
    • Any supported investment universe
    • Portfolio constituents
  • Weight importance

    Set an importance level for each constituent statistic.

    • Apply weights on a 1-9 scale for each statistic
    • Weights follow the mandate, not an equal default
    • A second mandate can reuse the constituents with different weights
  • Rank assets in a group

    Run FlexiRank™ to get ranking scores for each asset in a group.

    • Score every asset in the group on the FlexiRank™ statistic
    • Apply the same criterion to a portfolio, a peer set, or a group from more than one data set
    • Read the top and bottom of the order, then analyze the constituents

FlexiRank™ Unique Features

Stress-event losses as ranking constituents

A FlexiRank™ statistic is a weighted combination of measures the user selects. Stress-event losses can be among them. A ranking rule can therefore include CVaR, annualized return and maximum drawdown, and also the estimated maximum loss in chosen historical events — the 2008 credit crisis, the Bear Stearns failure, the 2010 Greek crisis, or any other event in the library.

Those event figures are not realized returns from the crisis window. They are outputs of the regression factor model: exposures fitted on the available track record, applied to the factor shocks of the event. A fund with a three-year history still receives a value for an event that predates it. Because the stress-test database stores that estimate for the supported universe, the event loss is available as a constituent for every name in the group, on the same basis as CVaR or drawdown.

The weight on the event constituent is the user’s. A mandate that treats tail loss in a named scenario as decisive can put more importance on it than on annualized return. A mandate that treats it as a check can keep the weight low. The rank then reflects both the conventional profile and the estimated event loss, instead of leaving the stress result as a separate report after the ranking is done.

FlexiRank™ and Peer Group Analysis

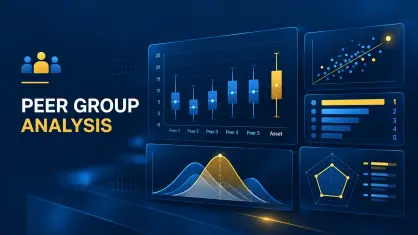
A composite score is useful for ordering a large investment universe, but the final ranking should not hide the statistics that produced it. Risk Shell therefore integrates FlexiRank™ with Multi-Statistic Peer Group Analysis. Users can review the underlying components of the synthetic metric and examine how each fund or manager compares with its peers across the individual statistics used in the model.

This combination provides both levels of analysis: FlexiRank™ produces the composite ranking, while Peer Group Analysis shows the structure behind that ranking. Investment teams can therefore move from a broad manager universe to a ranked shortlist and then examine the individual risk and performance measures responsible for each manager's relative position.

FlexiRank™ radar charts break the rank back into the underlying measures with multi-statistic peer group analysis. A fund at the top of the synthetic rank can be inspected on each axis: strong on the measures that carried the weight, or weak on one constituent and carried by the others. Used together, the rank orders the group and the peer chart shows whether that order is a balanced profile or an artefact of the weights.

Mandate-specific importance weights

A composite that weights every constituent equally is another single statistic. FlexiRank™ assigns an importance level to each measure, so the rank follows the allocation rule. A credit-sensitive book can put drawdown and estimated event loss above annualized return. A market-neutral book can put beta and correlation above absolute performance. The constituents can stay the same. The order will not. That is the operational difference from a screen or a peer chart. The screen drops names that fail a bound. The peer chart shows position on each axis. FlexiRank™ produces one order in which the axes have already been weighted. Changing a weight reruns that order on the same group. It does not require a new data extract or a second reconciliation of ten separate sorts.


FlexiRank Highlights

  • User-defined composite ranking criteria built from multiple underlying risk statistics
  • User-defined importance level for every statistic included in the ranking model
  • Extreme event stress test results are included in underlying risk statistics
  • Hundreds of possible combinations of risk and performance measures
  • Reusable FlexiRank presets for loading complex ranking models without rebuilding the criteria
  • Ranking of hedge funds, traditional funds, CTAs, equities and multi-asset portfolios
  • Ranking across multiple supported databases and peer universes
  • FlexiRank radar charts showing the contribution and relative position of the underlying measures
  • Integration with Risk Shell Multi-Statistic Peer Group Analysis: constituent breakdown of the rank in multi-statistic peer group analysis

Applications for Asset Managers and Fund of Funds Investors

  • Rank a large universe in one pass. Scoring 300 managers by hand on more than ten statistics, then ordering them, is about a week of work. FlexiRank applies the same weighted rule to the whole group in a few seconds.
  • Rank on a synthetic statistic — combine CVaR, annualized return, maximum drawdown, estimated event loss and any other selected measure, instead of sorting on one of them and reconciling the rest outside the rank.
  • Set the importance of each constituent. A credit-sensitive mandate can weight drawdown and tail loss above headline return. A market-neutral mandate can weight beta and correlation above absolute performance. Changing the weights reruns the rank. It does not restart the analysis.
  • Include stress-event losses in the rank. Estimated maximum loss in selected historical events is a constituent of the same statistic, weighted as the allocation rule requires, not a separate report after the ordering is done.
  • Inspect what produced the rank. The FlexiRank radar breaks the result into its constituents inside multi-statistic peer group analysis. A top name is either a balanced profile or one measure carrying the others.
  • Reapply a stored ranking rule. Presets keep the constituents and the importance levels. The same specification runs on the next universe, a portfolio, or a group drawn from more than one data set, without being rebuilt.

Risk Shell Components

Risk management and portfolio construction for alternative investments