Alternative Investment Management Software

Risk Shell

Institutional portfolio management, risk analytics and portfolio construction for alternative and multi-asset portfolios.

Integrated investment data, stress testing, portfolio optimization, alternative investment analytics and shadow accounting within one platform.

FoF Manager hero
FoF Manager

Shadow Accounting for Alternative Portfolios

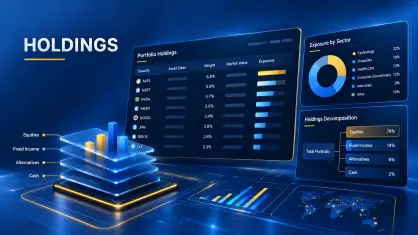
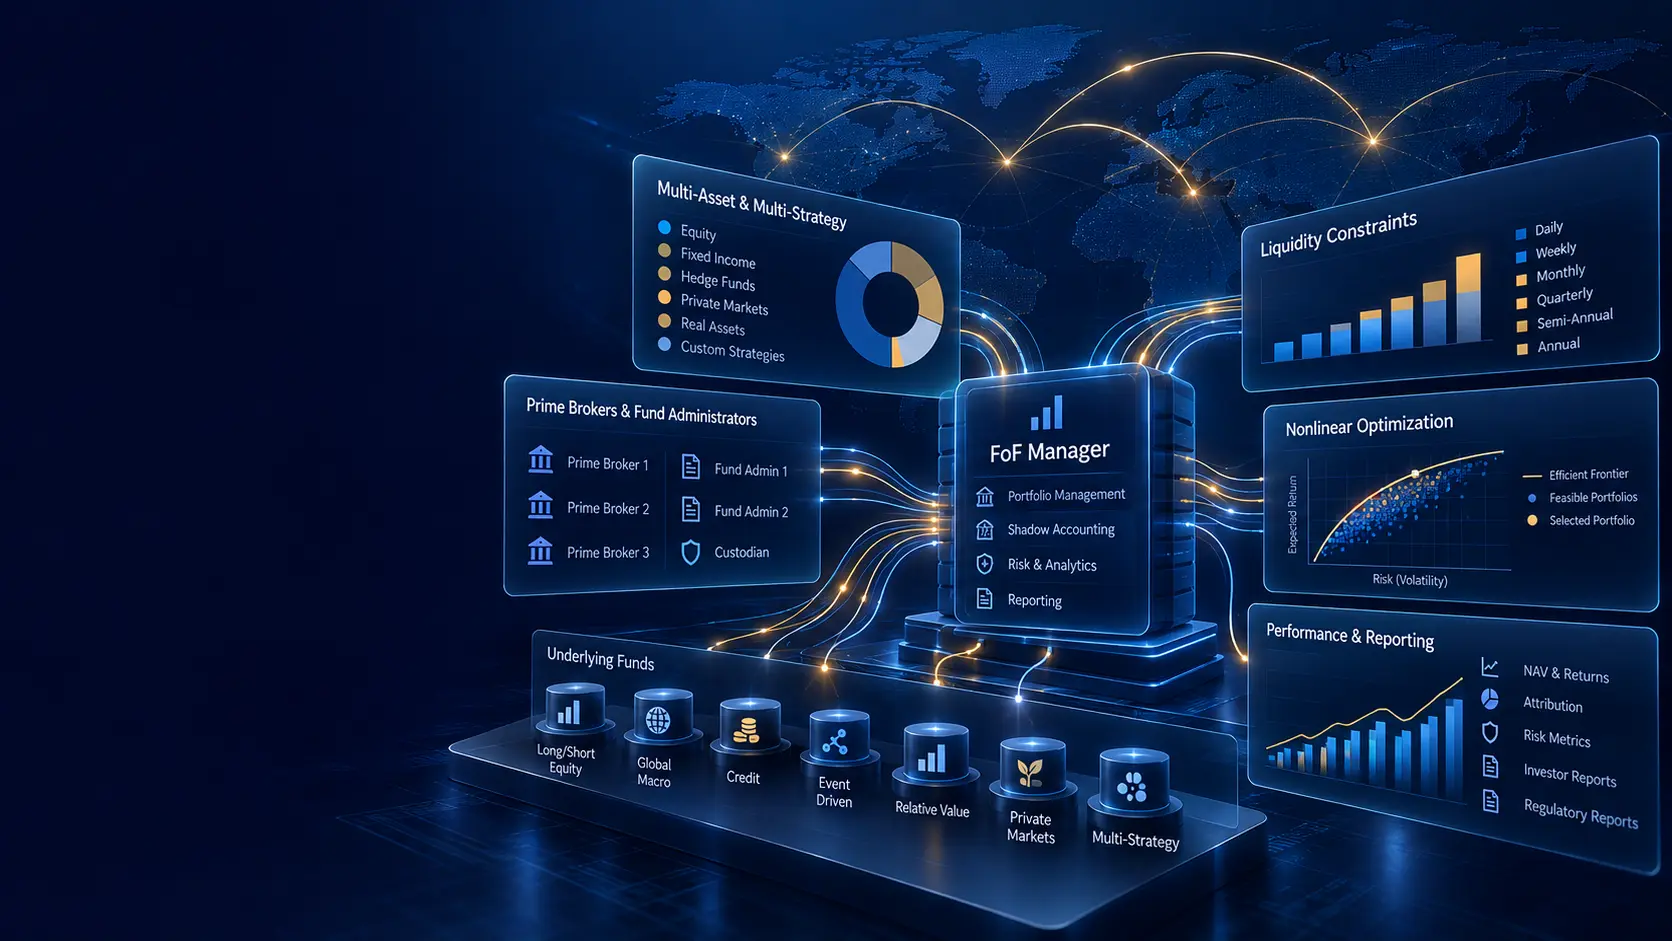
Manage hedge funds, private equity and multi-asset portfolios with liquidity controls, custom classifications and flexible historical accounting.

35+ hedge fund liquidity settings
Explore FoF Manager
Optimization hero
Portfolio Optimization

Nonlinear Portfolio Optimization

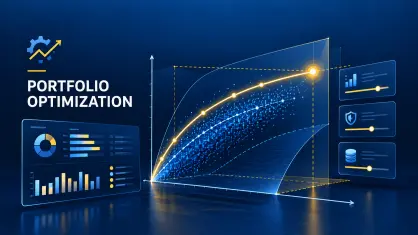
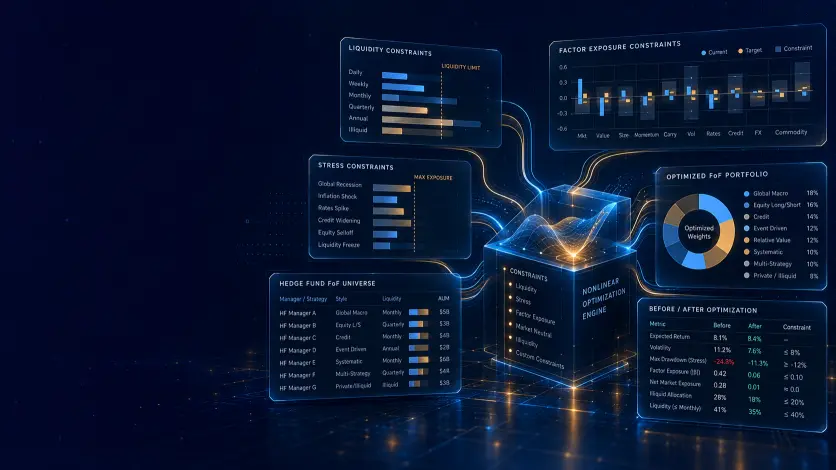
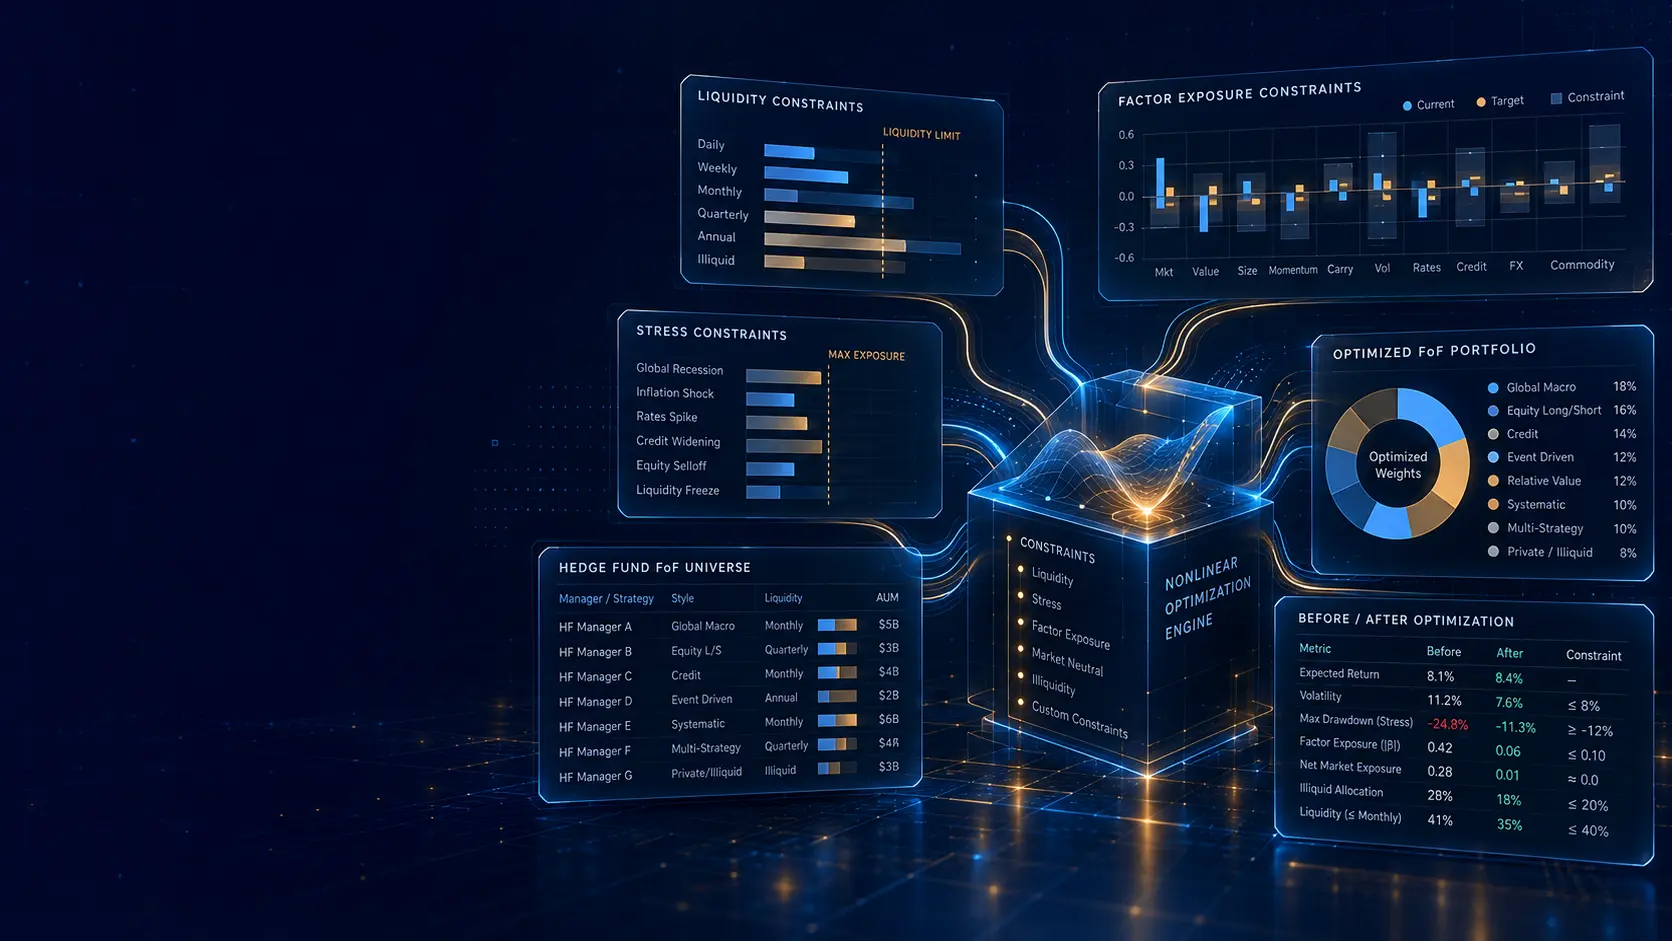
Construct hedge fund-of-funds and multi-asset portfolios with stress-test, factor-exposure, liquidity and other user-defined constraints.

Custom Constraints for market-neutral and risk-controlled portfolio construction
Explore Portfolio Optimization
Risk Shell AI hero
Risk Shell AI

Natural-Language Access to Risk Shell

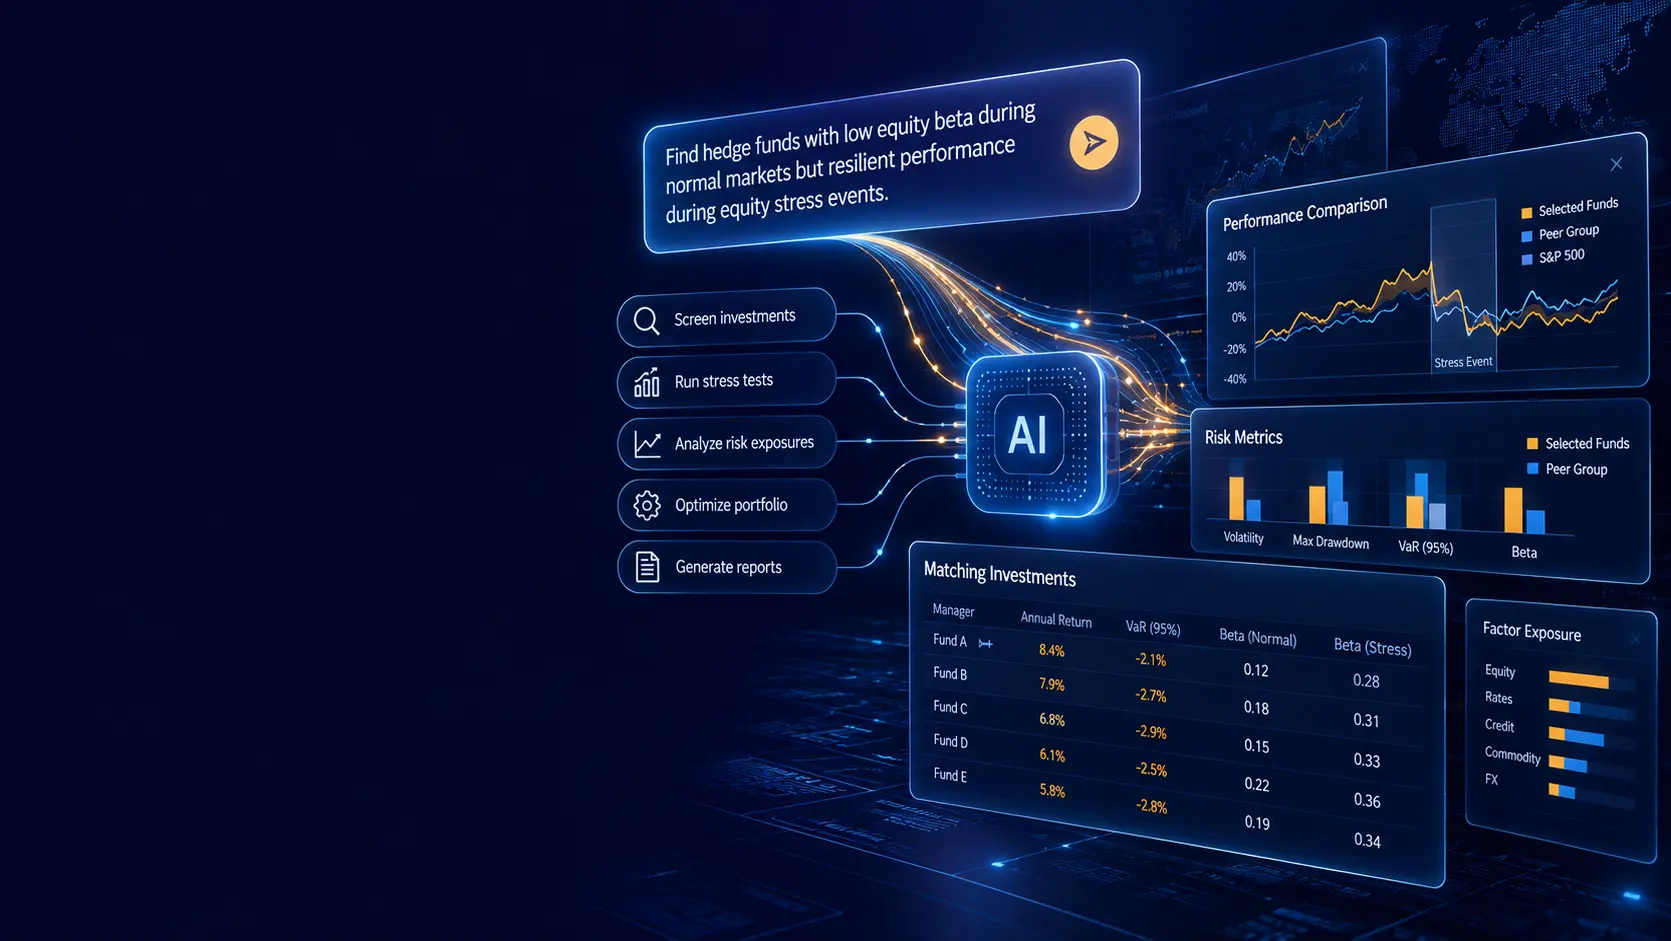
Use natural language to access investment research, risk analytics and portfolio workflows.

2.3B tokens in our in-house financial LLM
Explore Risk Shell AI
Macroeconomic Scenario Screening hero
Macroeconomic Scenario Screening

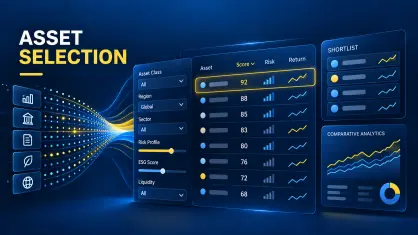
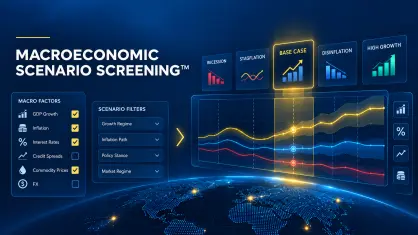
Select Assets for the Scenario You Define

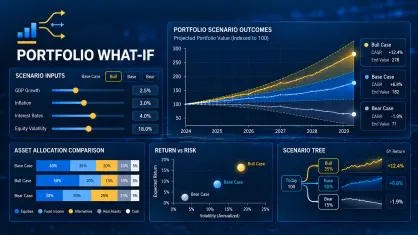
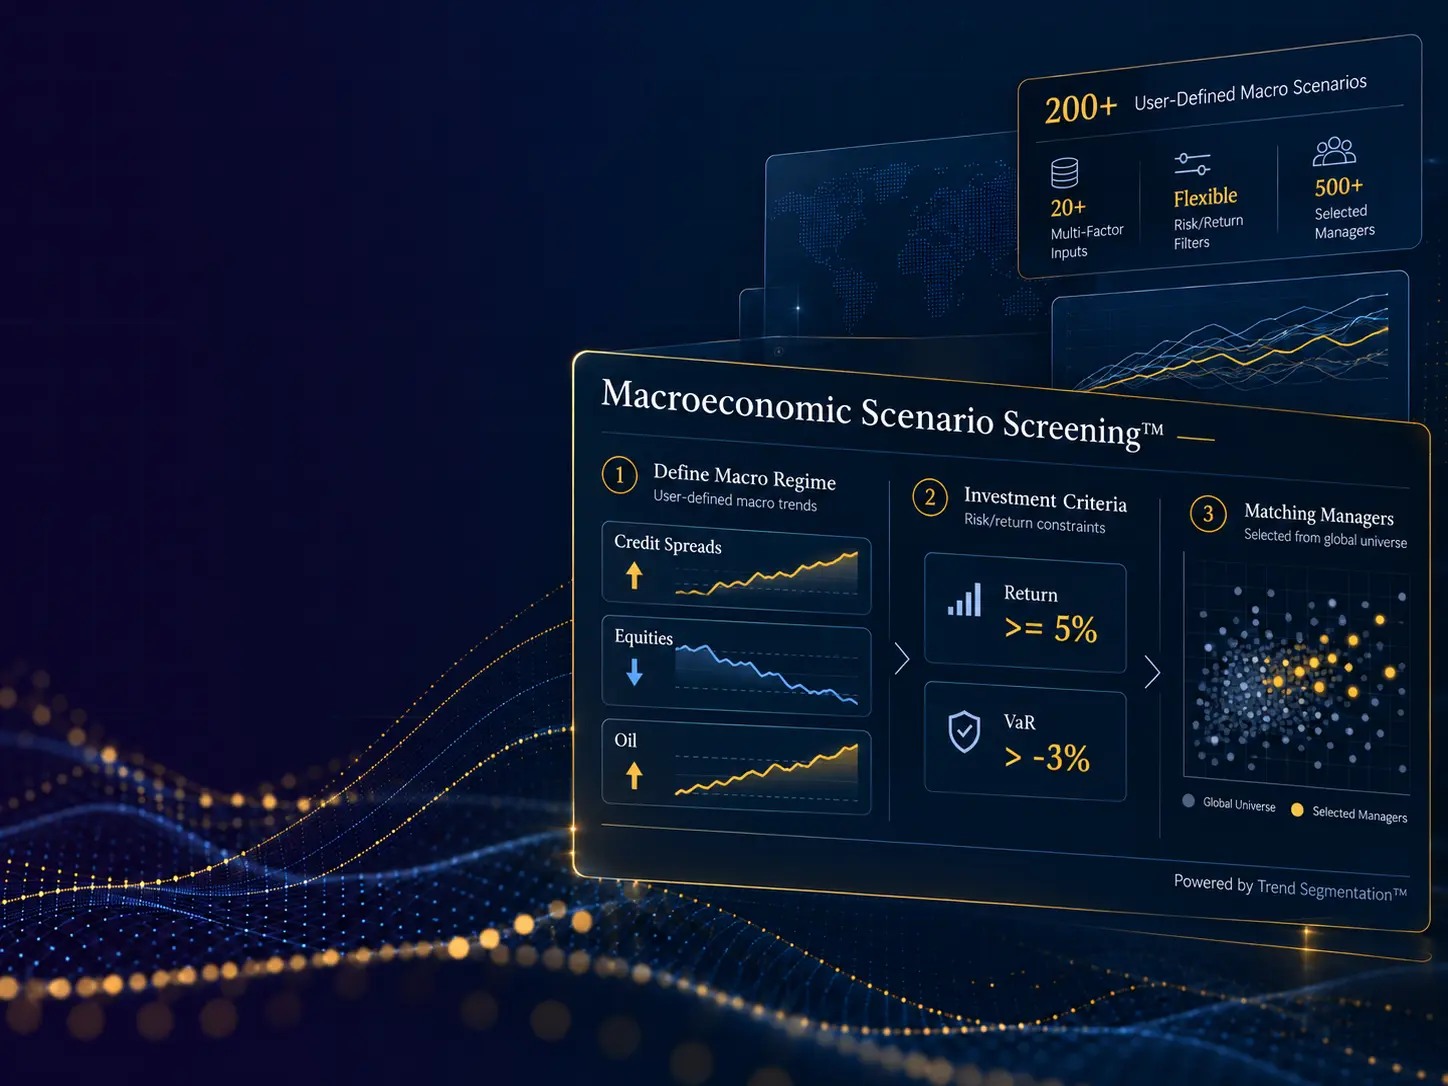
Screen managers by risk and return targets under user-defined macroeconomic scenarios.

Trend Segmentation™ proprietary regime-analysis engine
Explore Scenario Screening
Peer-relative Stress Testing
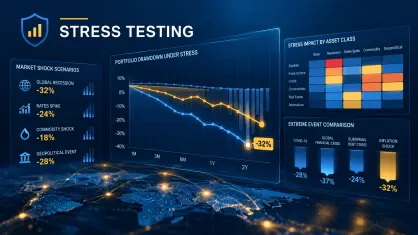
Portfolio Stress Testing

Peer-Relative Stress Testing

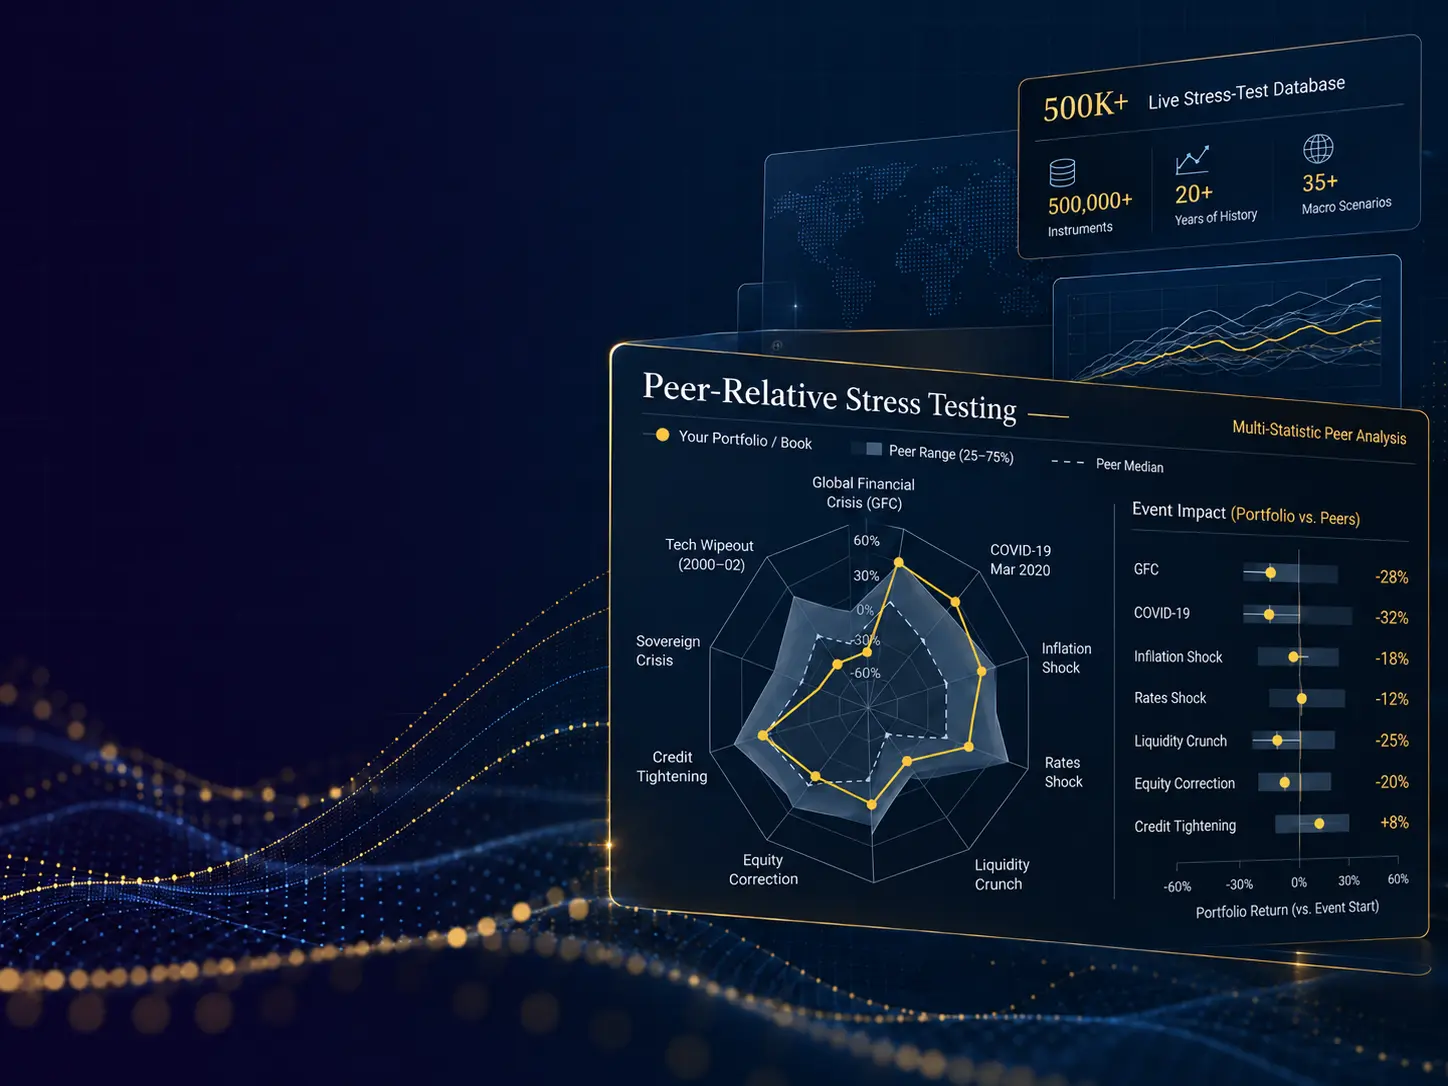
Compare extreme-event outcomes with a relevant peer group.

500K+ live stress-tested instruments
Explore stress testing

Peer Group Analysis for Hedge Funds and Fund of Funds

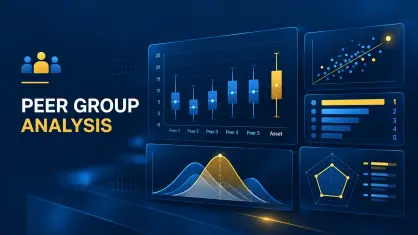
A conventional peer group analysis is a box-and-whisker plot of one statistic: return, volatility or maximum drawdown, with the peer quartile and the whiskers. The chart ranks the peer set on that statistic alone. It does not show the same funds on drawdown, VaR, beta and Omega at the same time. The analyst has to open a separate plot for each measure and make the comparison outside the chart.

Risk Shell keeps the box plot and adds multi-statistic peer group analysis, introduced by ABC Quant in 2005 for hedge fund assessment. The same peer set is ranked on several statistics at once and plotted on one chart. Each axis is a risk or return measure; the position is the fund’s standing against that peer set on that measure. A fund that ranks well on return and poorly on drawdown, VaR and Omega is visible as one profile, rather than as a series of single-metric quartiles.

The method was built for hedge fund of funds manager selection, where the peer comparison has to carry more than a return rank. It has since been extended to any multi-asset portfolio. The same peer group analysis now covers equities, ETFs, mutual funds, closed-end funds and money market funds. The statistic set is the one defined for the review. The peer universe is the one appropriate to the instrument.

What the peer chart is built from

More than 70 risk and return statistics are available, including VaR, maximum drawdown, Sortino, Omega, alpha, beta, upside beta and downside beta. Peer model presets store a chosen set of axes, so the same specification can be reapplied to another group. The peer set is user-defined: a strategy universe, a vendor classification, a custom list, or the constituents of a fund of funds.

Trailing mode ranks the group on one interval ending at a chosen date. Rolling mode recomputes the statistic and the peer comparison through time, so a rank that appears in a single window can be distinguished from one that persists. Several funds can be placed on the same peer distribution to compare multiple funds against a peer group. A fund-of-funds book can be read name by name against an external peer set, rather than only through the blended track record.

Supported Asset Classes

The Peer Group Analysis framework can be applied across different asset classes and asset universes, including:

  • Hedge funds
  • Equities
  • Traditional mutual funds, OEF and CEF
  • ETF
  • CTA
  • Multi-asset portfolios
  • Hedge fund of funds and multi-asset portfolios
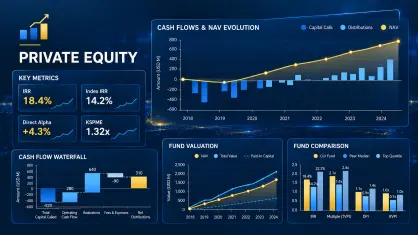
  • Private equity and other illiquid investment portfolios

Peer Group Analysis Features

Box plot and multi-statistic

The same peer set on a box-and-whisker plot of one statistic, and on a multi-statistic chart where each axis is a separate measure. One view for a quartile, one for the joint profile.

Asset coverage

Built for hedge fund of funds. The same peer group analysis now covers equities, ETFs, mutual funds, closed-end funds and money market funds. The peer universe follows the instrument.

Risk and return statistics

More than 70 measures, including VaR, Sortino, drawdown, Omega, alpha and beta. Each can be an axis on the peer chart.

Stress-event results

Estimated event losses from the maintained stress-test database, used as peer axes beside VaR, drawdown and beta. The rank is on the model result, including events before inception.

Windows

Trailing periods, rolling windows and user-defined intervals. A rank on one span can be separated from a rank that persists.

Peer sets

Peer model presets store the axes. The peer group itself is user-defined: a strategy universe, a vendor classification, a custom list, or the constituents of a fund of funds.

Currency conversion

Multi-currency instruments converted to a single currency before the peer comparison, so a rank is not an artefact of the reporting currency.

Multiple versus multiple

A book of funds plotted on the same peer distribution. A fund of funds can be read name by name against an external universe, not only as one blended track record.

Risk Shell Peer Group Analysis: Unique Features

Stress-test results as peer statistics

A distinctive feature of Risk Shell is the ability to include extreme event stress-test results directly in Multi-Statistic Peer Group Analysis. Stress losses from major market events can therefore be analyzed alongside conventional measures such as VaR, volatility, drawdown, Sortino ratio, Omega or beta.

This requires substantially more than calculating a stress test for the asset currently being viewed. ABC Quant maintains an ongoing stress-test database across the supported investment universe, including hedge funds, mutual funds, ETFs, equities and other instruments. Stress-test results are calculated and stored across the database so that they can be used as peer-comparison variables in the same way as conventional risk and performance statistics.

As a result, an investor can compare not only which managers produced the highest return or lowest volatility, but also how their portfolios would rank relative to peers under selected historical extreme events. This adds a tail-risk dimension to peer analysis that is difficult to obtain from traditional box plots or performance rankings alone.

Evaluating Assets With Different Return History

Stress axes are not realized returns from the event window. They are estimated event results from a regression factor model. The model is fitted on the track record available for the instrument. The fitted exposures are applied to the factor shocks of each historical extreme event. Because the event is represented by those shocks, the estimate is not limited to the fund’s live history. A fund with a three-year track record still receives a result for events before inception, including the 2008 credit crisis, the Bear Stearns failure and the 2010 Greek crisis. This approach allows evaluating assets with short historical return series - to resolve a common challenge of risk assessment of young hedge funds.

Producing those results for a peer chart requires the estimate for every name in the group, not a stress run on a shortlist. ABC Quant maintains a stress-test database across the supported universe — hedge funds, mutual funds, equities, ETFs, closed-end funds, money market funds and the other covered instruments — and updates it on an ongoing basis. Multi-statistic peer group analysis reads that database. An estimated event loss then sits on the peer radar beside VaR, drawdown, Omega, alpha and beta, and the group is compared on the model result.

Applications for Multi-asset and Fund of Funds Investors

  • Identify strengths and weaknesses across multiple measures — compare return, volatility, downside risk, tail risk and benchmark-relative statistics within one peer profile.
  • Evaluate overall manager risk profiles rather than ranking funds on a single performance or risk statistic.
  • Compare portfolio constituents against relevant peers to identify managers whose risk profile has become inconsistent with the rest of the portfolio.
  • Incorporate stress-test results into manager selection and monitor how funds rank under historical extreme-market scenarios.
  • Compare several funds against several peer groups, supporting manager research, portfolio monitoring and fund of funds due diligence.
  • Test whether a rank persists. Trailing mode is one window. Rolling mode recomputes the statistic and the peer position through time, so a strong result in a single span is separated from one that holds.
  • Place a short-history fund on an event axis. The stress result is a factor-model estimate, not a replay of 2008. A three-year track record can be ranked against older peers on the credit crisis, Bear Stearns and the Greek crisis.
  • Remove the reporting currency from the comparison. Multi-currency instruments are converted to one currency before the rank, so a difference in track record is not a difference in the unit of account.
  • Treat the peer set as part of the analysis. A strategy universe, a vendor classification and a custom list will not produce the same rank. The chart shows position in the set that was chosen, not an absolute quality score.
  • Flag a profile that cannot occur. No fund leads its peer set on every axis at once: highest return together with the lowest volatility, drawdown and VaR. A name in the top quantile across all of them is not a better manager. It is a reason to check the data, the peer classification, or the track record itself.

Risk Shell Components

Risk management and portfolio construction for alternative investments